
Getting Edgerouter metrics into Prometheus
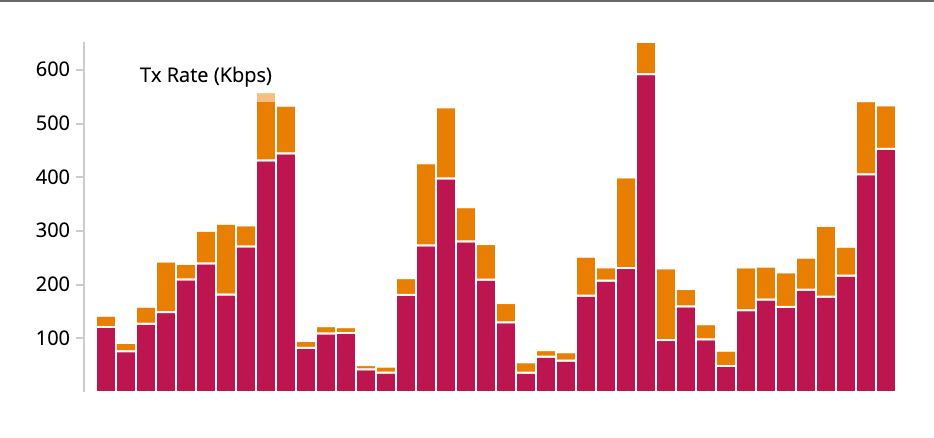
—I got an Ubiquiti Edgerouter Lite as the router at home and while it has its admin interface providing current traffic flowing in an out it does not store any historic metrics. Also it only shows a window of data with unspecified time for each bar it is quite useless as you can see in the picture below.
I already have Prometheus and Grafana set up for other purposes so naturally I wanted to ingest the metrics from my router into Prometheus.
Edgerouter supports exporting metrics metrics via SNMP and Prometheus can import via a separate daemon called snmp_exporter. It basically connects to devices over SNMP, collects configured metrics and exposes those metrics via webserver that Prometheus can poll.
I installed snmp_exporter on my FreeBSD server which is running Prometheus. snmp_exporter uses a config file called snmp.yml which can be generated by the utility snmp_exporter_generator that comes bundled with snmp_exporter. To generate the config needed the snmp_exporter_generator uses yet another yml file called generator.yml. Fortunately someone else has created the one that is needed for the Edgerouter and it can be found at https://github.com/j18e/prometheus-edgerouter.
The first thing I needed to do is to enable SNMP in the Edgerouter admin and select a community string, which is the password SNMP uses. Unfortunately I dont think it does SNMPv3 so everything is unencrypted 🤷♂️.
Then I copied the generator.yml from the GitHub repo above and entered the community string and then ran snmp_exporter_generator generate to output the snmp.yml. On FreeBSD it uses the /usr/local/etc/snmp_exporter paths by default so needed sudo for that which is a bit weird, I expected it to take the file from current directory and generate it in there as well.
To finish I added a new SNMP job to the prometheus.yml:
  - job_name: 'snmp'
    scrape_interval: 5s
    static_configs:
    - targets:
      - 192.168.1.1
    metrics_path: /snmp
    params:
      module:
        - edgerouter
    relabel_configs:
    - source_labels: [__address__]
      target_label: __param_target
    - source_labels: [__param_target]
      target_label: instance
    - target_label: __address__
      replacement: 127.0.0.1:9116
and restarted Prometheus to reload the config.
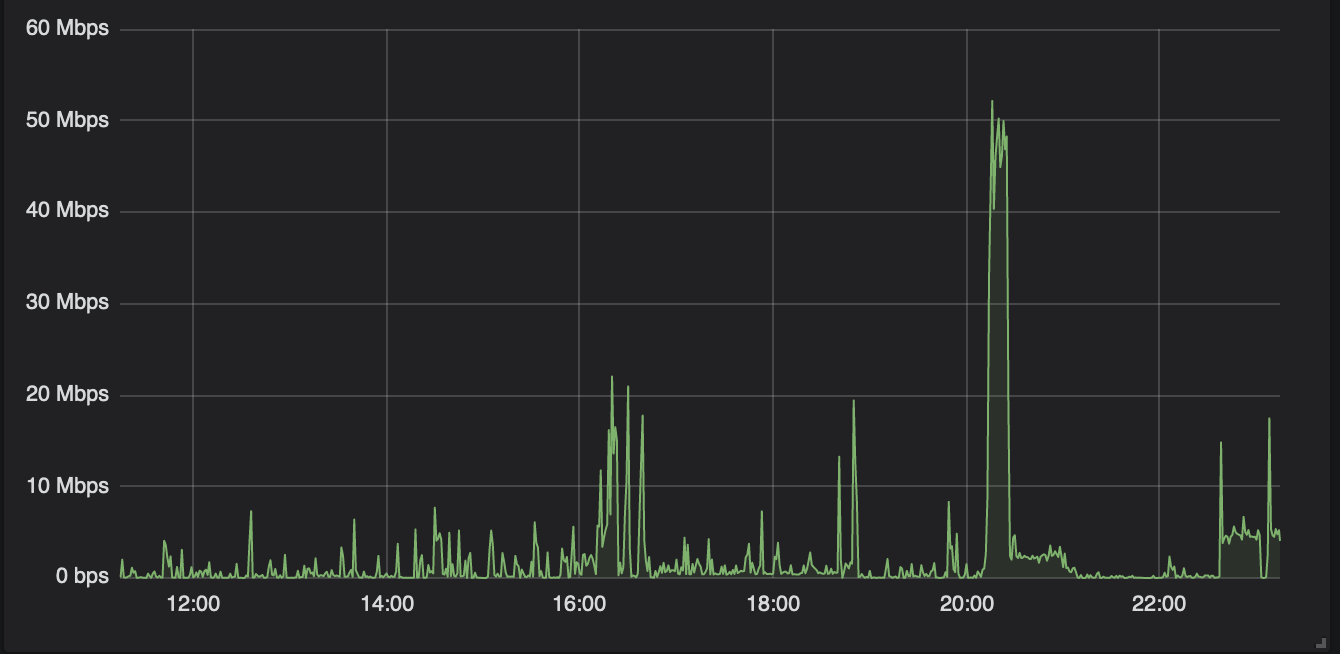
To graph this in Grafana I added a panel and used 8*rate(ifHCInOctets{ifName="eth1"}[60s]) as the query for received bits/s which gives us a graph like this:
and then 8*rate(ifHCOutOctets{ifName="eth1"}[60s]) for sent bits/s.